
Q: Why not just use a line graph like everyone else?
A: The human brain seems to have settled on the line graph as the preferred mode of data-tracking. Clarity of presentation is key, but one must distinguish between noise-reduction and sacrificing crucial data to give the appearance of tidiness. Line graphs imply that there is a continuous data stream, rather than intermittent data points. Furthermore, a point on a line graph may consist of a single or multiple data points. A single data point is not a scientific sample, nor is the average of multiple data points from disparate and non-analogous sources; not to mention the discontinuity of various combinations of segueing data points concealed within a fluid-seeming graph that succeeds in encrypting valuable data that could easily be visualized otherwise, or the fact that points in time without any data are treated with the assumption that the most recent data stands until explicitly refuted, and that once refuted a line is simply drawn from it to the next point.
Q: When is a line graph "good"?
A: The optimal application of a line graph is to map a continuous stream of data. Since continuity entails the acquisition of infinite data-samples, we quickly find this condition to be unattainable. So while a line graph is never completely accurate, accuracy does increase with sample frequency. A daily tracking poll of president Obama's approval rating, for instance, would be much more suited to this mode of visualiztion than, say, a bi-monthly poll.
Examine the following graph:
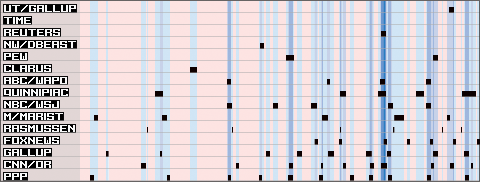
GOP Primary 2012
(Polling conducted between 9/1/10 and 8/31/11)
Data points indicate activity-by-pollster over time. Dark blue bands indicate periods of heavy activity while the pinkish ares are periods of no activity. Observe how relatively scant the available data is (any line graphs on the topic ought to be taken with a grain of salt). And to use an audio-engineering analogy, one can easily "solo" or "mute" the activity of a particular pollster.