Friday, December 30, 2011

1000 Days In: Update II


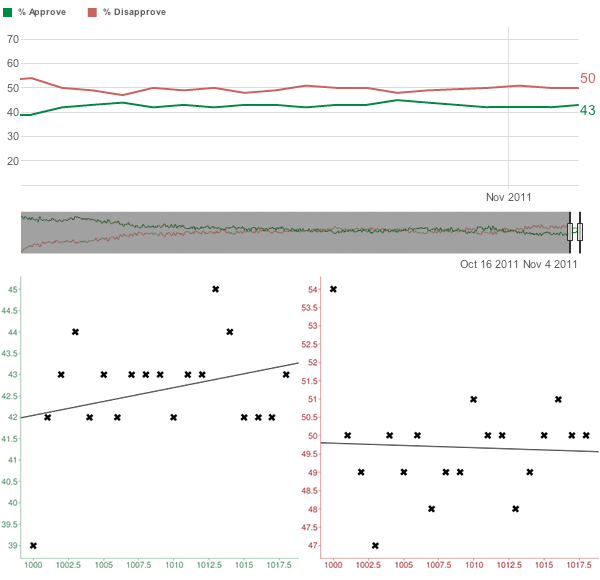
Top: Gallup approval/disapproval data for President Obama visualized via scatterplot and regression line from his 1000th day in office (10/17/11) to the present (12/30/11). Above: observe the data points in the lower graph; in only 28% of samples has disapproval risen to or above the 'crucial' 50% mark, and it should be noted that the range of disapproval below 50% is much greater than the range above (either three or five times greater, depending on whether you count the single data point at 45%).

Click here to read the original article. Click here to download the complete trend.

Click here for Gallup interactive comparisons. Click here for newest polls.

Below: Gallup interactive poll widget.
For dual-deck widgets (for your mixing pleasure) click here

Either scripts and active content are not permitted to run or Adobe Flash Player version 10.0.0 or greater is not installed.

Get Adobe Flash Player

Saturday, December 24, 2011

McConnell's Threefold Miscalculation — Update

On the surface, two months of payroll holiday extension for a decision on Keystone XL is not a victory for the Dems — this was Mitch McConnell's calculus. He had no reason to believe Speaker Boehner would turn down such an offer; the problem is that he did. Had he not, the eventual (and inevitable) outcome would almost certainly be seen as a GOP victory. The victory for the Dems is not a legislative one, though it will almost certainly parlay into one two months from now. Rather, Obama and the Democrats have won the message war (or more accurately, Boehner has lost it). Until now, the GOP strategy was to play to the general public's relative disengagement from the details of politics… when there is gridlock, 'Washington' in the abstract gets the blame which hopefully trickles up to Obama. This time, however, the public was tuned in and the performance was overacted and lacking in nuance, and due to unprecedented viewership there's no reason why the sequel two months from now can't be a shameless lift of the original (just with a bigger budget).

To answer the question of why Boehner blinked, it may not be so much a matter of his having been strong-armed by Cantor's goons. The initial miscalculation was, once again, McConnell's. It became apparent once the senate passed their bill with 89 yeas that forcing a Keystone XL decision may actually be doing Obama a favor (as outlined in the original post). Way to go, guys!

Sunday, December 18, 2011

McConnell's Threefold Miscalculation

1. The payroll tax narrative has been dogging the GOP. It would benefit them to put it to rest, not revisit it in two months. Part of the Dems' strategy was to force the initial vote, now the senate has voted with 89 'yeas' to force congress to do it all over again. This will essentially be a redux of the very display that has helped isolate the GOP as the brinksmen and obstructionists in a historically unpopular congress. As it turns out, the party of tax cuts is not equal-opportunity, and if anybody missed that this time around, they'll have another chance to tune in.

2. President Obama is eventually going to say 'no' to the Keystone XL pipeline. If he had just come out and said it without first appearing to weigh the costs vs benefits, the decision would have seemed rash and political… but the GOP has has done that job for him; he will now will have no choice but to come out and say (through a surrogate, of course) "due to time constraints, we will be unable to adequately evaluate the environmental impact of the Keystone XL pipeline and are therefore unable to grant permits."

3. President Obama came before the press yesterday professing satisfaction with the senate bill — it's only right that he should be deeply satisfied for the reasons mentioned above, and Speaker Boehner, who now has to either eat this bill or risk making his party seem factious at best and obstructionist at worst, knows this. Good job, Mitch McConnell.

Monday, November 7, 2011

1000 Days In: Update

Click here to read the original article. Click here to view the newest polls.


Top: Gallup approval/disapproval data for President Obama from his 1000th day in office (10/17/11) to the present (11/7/11). Above: regression analysis of both data sets indicates a measurable rise in approval during that period, and while disapproval during the same period fell by a relatively modest degree, what is significant is that it has been hovering around and occasionally cracking the magic 50% mark.


Click here to read the original article. Click here to download the complete trend.


Click here for Gallup interactive comparisons. Click here for newest polls.

Wednesday, October 26, 2011

History Repeats Itself (or Not)


Yesterday, Mitt Romney gave reporters this oft-repeated pearl of conventional wisdom: "Can't win the White House without winning Ohio", he told them. Is this true?

Here's a comparison: the NFC team almost always wins the pre-Super Bowl coin toss. Since 1994, the AFC team has only won twice; in fact, between 1998 and 2006 the NFC went totally undefeated in this event (odds 1 : 512).


AFC
NFC
2006
lost
won
2005
lost
won
2004
lost
won
2003
lost
won
2002
lost
won
2001
lost
won
2000
lost
won
1999
lost
won
1998
lost
won

Does the above table tell us that only NFC teams can win coin tosses? Of course not. That's ridiculous, but no more so than a lot of other things...

2008
365_173
FL
OH
2004
286_251
FL
OH
2000
271_266
FL
OH
1996
379_159
FL
OH

Above: results of past four presidential elections by electoral votes. In all cases, winner took FL and OH.

We hear it time and time again: correlation is not causation, and yet we generally heed the warning only so far -- a few concurrent data points can be chalked up to coincidence, sure, but too many and one begins to suspect a pattern. In the coin toss example, we make a special consideration -- however uncanny the degree of correlation, we know that coin tossing is gambling so it must be one of those rare coincidences -- but how rare are such coincidences?

Prior knowledge of the random nature of coin tosses prevents one from imagining that there might be any causal relationship in this particular scenario, but what about scenarios where the characters are unfamiliar? Just how often is noise mistaken for meaningful data?

1992
395_143
FL
OH

Move the baseline back one cycle and the premise that FL is necessary to win the presidency is proven false. The fact that the winner of every election since 1964 has taken OH merely demonstrates correlation (think 12 consecutive coin tosses coming up heads) augmented by the fact that since the winner generally takes the most states, one of them is likely to end up being OH. To test the statement's veracity one must address how often, if ever, the victor would have won without FL and/or OH:


+ FL, OH
- FL
- OH
- FL, OH
2008
365_173
338_200
345_193
318_220
2004
286_251
259_278
266_271
239_298
2000
271_266
246_291
250_287
225_312
1996
379_159
354_184
358_180
333_205
1992
395_143
370_168
374_164
349_189

Above: results of past five presidential elections by electoral votes (in bold letters) including hypothetical scenarios in which FL and/or OH are given to the losing candidate.

Were we to extend the table back to 1920, we would find that with the single exception of George W. Bush, giving FL and OH to the other candidate would fail to alter the outcome of the election. So what is the origin of this peculiar and totally false belief held by Romney and so many others? Most likely the lens of recent history: it seems this piece of lore made its way into the collective largely due to the resemblance of Kerry's narrow defeat in 2004 to Gore's in 2000, at the hands of FL and OH, respectively.

---

Update (10/29): "We can't win without Florida"

Wednesday, October 19, 2011

Corn Belt Politics

Ever wonder why the GOP hates ethanol subsidies? Well, what has the Corn Belt done for them lately? The juicy states with all the electoral votes went for Obama in 2008 except Missouri, which just barely went to McCain anyway.

Monday, October 17, 2011

1000 Days In: Is There a Pattern Here?

Updated 12/30/11 - Click here

Above: Gallup approval ratings for presidents Obama, Clinton, and Reagan (dark green, light green, and yellow lines, respectively) for their first 1000 days in office.
Green bands indicate periods during which all three were polling within a five points of each other.

Above: Gallup approval ratings for presidents Clinton and Reagan during the remainder of their initial terms.

By 1000 days in, the anti-incumbent field has become locked in and we begin cementing our collective judgment as to whether we prefer the current president to any of his potential replacements (eg: president Obama vs generic Republican / president Obama vs actual Republican). The way president Obama's approval ratings trend from here on out will be an indicator as to whether he has won this best-man-for-the-job contest.

While well run campaigns inevitably improve perceptions, it is simply bad form for a president to begin overtly campaigning too soon before an election; 1000 days seems to be the starting gun.

---

Update I: 11/7/11: New Article
Update II: 12/30/11: Newer Article

Saturday, October 15, 2011

A Tale of Two Belts

Above: the Rust Belt as defined by counties in the region suffering a net per-capita income loss between 1980 and 2002; blue and red indicate counties that went to Obama / McCain, respectively; the pink region indicates the Bible Belt (click for a larger view).

A curious phenomenon in Rust Belt states which are also Bible Belt states: net per-capita income loss can be counted on to translate into a Republican vote with an almost uncanny degree of certainty. The inverse is also true: counties that went to Obama in 2008 could be relied on to have enjoyed a net per-capita income gain between 1980 and 2002. Notice the gerrymandered appearance of the county blocs in states with an inordinate degree of red; the 'spaces in between' tend almost exclusively to have gone blue.

Saturday, October 8, 2011

The Principled South

...or how those who hated the Democrats most secured the election for Truman:

The Dixiecrat insurrection occurred after southern Democrats realized FDR was not an extremist, but a populist who had changed their party forever and whose successor was unlikely to give much special attention to the cause of the south rising again the way previous Democrats had. With each election, FDR's margin of victory narrowed but in 1944 he still routed Thomas Dewey, himself a moderate, who would go on to lose to Harry Truman in 1948.
  
By today's standards, Dewey and Truman may as well have been the same guy; America had emerged from the depression and the war with a near-universal populist attitude. Indeed, the ideological convergence of the two parties may have been the very mechanism that allowed for a viable third party insurrection. Still, partisan identity is serious business; were one to allege at the time that the similarities between the two major candidates outweighed the distinctions, one would have received the sort of opposition one might expect from someone who's been buying Fords his whole life and has just been told they're essentially the same as Chevys. But when your way of life seems at risk, partisanship goes by the wayside and it is ideology that counts. Southerners recognized that they no longer had a partner in the Democrats. To them, the choice was yankee candidate 'a' vs yankee candidate 'b'.

Above: Blue denotes states to include Strom Thurmond, the Dixiecrat, on the Ballot in 1948. Light blue indicates states won by Thurmond. If any of this seems familiar it's because these are the exact states that seceded from the Union and formed the Confederate States of America in 1861.

Contained within the preceding map is one explanation for why the 1948 election went to Truman and not Dewey. On the surface, and without historical context it may appear that votes lost to the Dixiecrats were votes lost by the Democrats; so how exactly does this help Truman, one may ask? Well, one must remember that in the Bible Belt (aka former confederacy) this election was a referendum on the Democrats, so votes lost would likely have gone to 'not Truman', which without the Dixiecrats would have meant Dewey. But to Dewey's dismay and miscalculation, this was not the case; the voters in the Bible belt wanted something more than just 'not Truman'; they needed it to be their guy, even if it meant losing to Truman.

Above: the former confederacy is indicated by shaded areas; the reddish patch signifies the Bible Belt, a southern-Baptist voting bloc.

Examine the overlap in the preceding compound map. This is not a cynical observation; in the event of the dissolution of physical borders dividing two cultures, religion often serves as a marker, helping preserve and reinforce the distinctions between those cultures. So remember this: when the south feels ignored, it's not just about religion, or politics; it's about national identity. The only time the south votes for the winner is when it's their guy.

So the question is... If Mitt Romney gets the nomination, will he receive a third party challenge, or at least a no-vote from the southern-baptist demographic?

Update -- literally as I'm writing this, I read this and this

Friday, September 30, 2011

Two Counties May Decide 2012 Election


Above, from left: Pinellas county, Hillsborough county; state of Florida county map.

A few things to keep in mind going into the 2012 cycle:

• For the past four cycles (the modern electoral era) Florida has gone with the winner.
• Since 1960, Hillsborough county has always gone with the winner.
• Within the past four cycles, it has gone to both parties twice.
• For the past four cycles, the margin of victory has never been >400k votes; total votes for Hillsborough county + Pinellas county in 2008 were just under 1 million.
• These two counties went to Obama in 2008; if he can hold them, all counties that did not go either exclusively D or R during the past four cycles could go R and he would still win the state in 2012, assuming all counties that have consistently gone either D or R continue to do so.
• The margin of victory in Hillsborough county tends to be relatively slim. In the hypothetical scenario where the county swings heavily toward Obama, he could take the state by winning all safe D counties and Hillsborough alone.

Tuesday, September 20, 2011

Defining Swing States, part 1

Above: President Obama's margin of victory/loss-by-state, 2008 (list)


Above: President Obama's margin of victory/loss-by-state, 2008 (vertical axis); electoral votes-by-state (horizontal axis). Shaded areas indicate electoral votes lost between 2008 and 2012; green areas indicate electoral votes gained. (list)